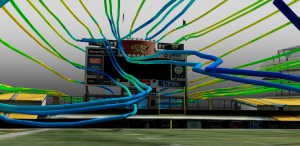
The 100 million television viewers tuned in to Fox Sports’ broadcast of Super Bowl XLVIII on Feb. 2 saw a new visualization tool that displays on screen the swirling arrows of wind vectors inside the stadium. The flight of the football is affected by currents of air unseen by the players or fans in the stands but clearly revealed to those watching on television and the internet.
The arrows are generated by computational fluid dynamic (CFD) modeling of the interaction between prevailing winds and New Jersey’s MetLife stadium, which was represented by a geometric 3D model. The CFD analysis was run courtesy of Autodesk, which Fox Sports approached in December after it heard of a modeling experiment the company had sponsored a few months earlier.
The MetLife CFD modeling was not based on live data but on dozens of visualizations of different scenarios of wind speed and direction. During the Super Bowl, the Fox Sports broadcast showed on screen the wind vector patterns that were likely being generated by the prevailing wind conditions during the game.
The modeling is an extension of a project tackled last summer by an architecture intern. Working on a grant from Autodesk, Matt Wilson tested how a non-CFD specialist could use Autodesk’s new cloud-based CFD modeling tools to analyze the squirly wind patterns in another stadium, the Pittsburgh Steelers’ 22-year-old home, Heinz Field. The field is notoriously difficult for kickers, and a public debate is now under way in Pittsburgh as to whether to dampen the vortices by modifying the facility’s architecture.
Wilson, a summer student intern from Penn State University, performed the simulations. To analyze the winds, he was challenged to use Autodesk’s tools, including Revit, an app called ForceEffect Flow, Project Falcon (now called Flow Design) and CFD/SIM 360 Pro.
John Twerdok, Autodesk’s Pittsburgh-based senior manager of digital prototyping at the time, challenged Wilson to simulate the airflow by starting with 2D flow modeling, then 3D macro flow modeling and, finally, fine-tuning the study to a full 3D CFD analysis that incorporated weather data to help explain why kickers there have such a miserable time, particularly at one end of the field.
“He started off with iPad tools, using Force Effect Flow, a free app that lets you take a 2D photo and sketch a free-body diagram and develop a quick 2D profile to look at the air,” says Twerdok. “We saw, in just 2D, a lot going on with airflow as it enters that end of the stadium.” The process of modeling was refined progressively as areas of interest were identified.
The modeling continued using wind-flow simulation software called Project Falcon to develop a macro flow model of the stadium, using a 3D Trimble SketchUp model of the stadium available from SketchUp’s free library, which includes all the NFL stadiums.
“That looked so good, I unleashed him to do a full 3D model and a full simulation of the entire stadium,” Twerdok says. “The wind-flow analysis was completed in SIM 360 CFD professional, our cloud-based CFD solver."
The results were “just spectacular,” Twerdok says. “It looks photographically realistic. There is a large JumboTron—just a huge, flat panel—alternately acquiring and shedding vortices at one end of the stadium. It was pretty dramatic.”
In the future, CFD modeling “should get a lot more attention in design and construction. It’s an area that, previously, was not so accessible to the architectural community, but now you don’t have to be a full-born CFD expert to do it,” Twerdok says.


Post a comment to this article
Report Abusive Comment