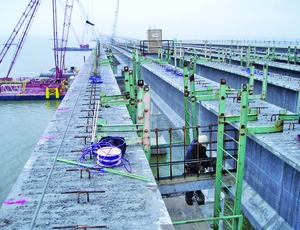

When the power is activated on the new 5.4-mile-long, $803-million I-10 Twin Span Bridge outside of New Orleans in October, it will transform an icon of the region's recovery from 2005's Hurricane Katrina into a beacon of cutting-edge information-technology usage on bridge design and construction.
An embedded sensor array—including, from deck to piles, a concentration of devices in a key bent and pier of the main navigation span—already has served to validate significant construction and design calculations, even before the array goes into service providing structural heath monitoring during operations.
A total of 340 devices, including weigh-in-motion sensors, corrosion meters, strain gauges, tilt meters, inclinometers, accelerometers and water-pressure cells, will help paint a much clearer picture of the effects and ramifications of movement in the bridge, such as traffic loads, environmental factors such as wave action and storm surge and incidents such as ship impacts.
“No one has ever really done a complete system like this before,” says W. Allen Marr, president and CEO of Geocomp Corp., Acton, Mass. The firm installed the sensors, designed a data management system behind them and will monitor the setup until handover to the owner on Jan. 1.
“Others have installed monitoring systems on only the foundation or only the superstructure,” Marr says. “What's unique here is the idea of being able to monitor effects of loads on both the superstructure and the foundation at the same time. If a heavy truck goes across the bridge, I know how that impacts the structural elements all the way down to the soil foundation.”
After Katrina's 30-ft storm surge destroyed about 40% of a 1960s-era bridge that brought I-10 over Lake Pontchartrain, the Federal Highway Administration funded a replacement. In the absence of any American Association of State Highway Transportation Officials bridge design standards for hurricane wind and wave resistance, the Louisiana Dept. of Transportation and Development designed a bridge that is much higher and sturdier than its predecessor and which incorporates many redundancies to resist ship impact, wave- surge uplift and wind (ENR 12/11/06 p. 14).
However, the La.DOTD wanted to do even more. “There is an effort nationwide to leverage electronics to monitor bridges, and we saw an opportunity to validate design assumptions, to do a better job of asset management and to learn more with this new bridge,” says Arthur D'Andrea, DOTD's project manager and assistant bridge administrator.
The Louisiana Transportation Research Center (LTRC), a research division within the DOTD that is co-sponsored by Louisiana State University, competed for FHWA Innovative Bridge Research and Deployment Program funds to perform health monitoring on the bridge, says Mark Morvant, the center's associate director of research. Ultimately, LTRC received three awards totaling $650,000 to install the system and conduct both short-term monitoring during construction and long-term monitoring during service.
The short-term monitoring was a lateral load test conducted in February 2009. The DOTD wanted to validate assumptions about the stiffness of the battered-pile groups, which were in similar soil conditions, reacting to loads such as barge collisions and windstorms, D'Andrea said.
While the bridge was still under construction, the DOTD team came up with the idea of lashing one pier of the eastbound span to one pier of the westbound span with 19-strand post-tensioning cables and, using two 600-ton hydraulic jacks, loaded 1.8 million pounds, or 1,800 kips, of horizontal pressure to see if the foundations would react as calculations predicted.
Since electrical service to the bridge had not yet been turned on, Geocomp used portable generators to power the instrumentation. Some instruments in the array had been built into pre-cast pilings; other sensors were installed during construction. “It turned out to be very reliable, inexpensive and very effective, because it used readily available, simple equipment that the contractor was familiar with,” Marr says.
To measure lateral movement and rotation on the pile caps, Geocomp used a total robotic station atop the next adjacent unloaded pile cap. “Putting 1.8 million pounds of lateral load on a new bridge is not something you do every morning,” Marr says.
To get the event results, Geocomp installed a big-screen TV atop a nearby pile cap to display the results calculated by computers some 1,300 miles away. “Using our real-time monitoring system, the data loggers sent data [by Internet protocol phones] back to our server in Massachusetts, where the data was crunched, then sent back to display on the TV what was happening in the test,” Marr says. “We knew—literally, right there—that the results came close to the ¾ inches of movement the engineers had predicted,” he said. “There was great jubilation among the designers.”

Post a comment to this article
Report Abusive Comment